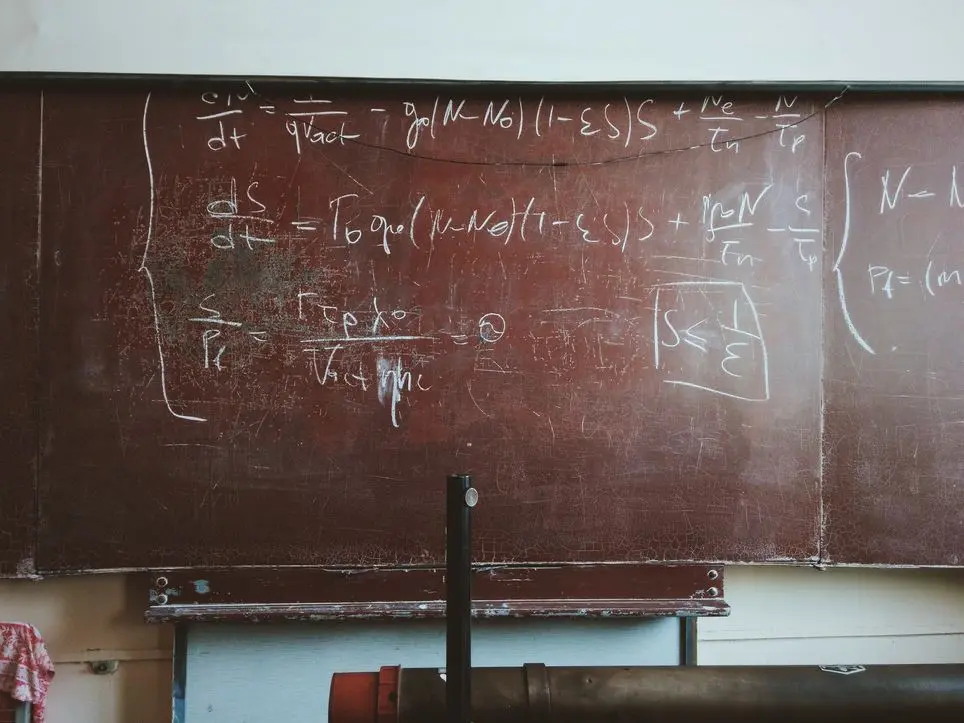
Mathematics is the study of abstract topics such as quantity (numbers), structure, space, and change. There is a range of views among mathematicians and philosophers as to the exact scope and definition of mathematics. Mathematicians seek out patterns and use them to formulate new conjectures. Mathematicians resolve the truth or falsity of conjectures by mathematical proof. When mathematical structures are good models of real phenomena, then mathematical reasoning can provide insight or predictions about nature. Through the use of abstraction and logic, mathematics developed from counting, calculation, measurement, and the systematic study of the shapes and motions of physical objects. Practical mathematics has been a human activity for as far back as written records exist. The research required to solve mathematical problems can take years or even centuries of sustained inquiry.[read more at wiki]
合格率、卒業率、学生数、学生対教授の比率(数学専攻の上位10大学)
3つの州立大学と9つの私立大学が数学専攻トップ10にランク含まれました。数学専攻上位大学の平均合格率は12.50%であり、ハーバード大学が5%の最も低い合格率を見せニューヨーク大学が32%で最も高い合格率を示しました。総305,464人の学生がこの大学のいずれかに通っており、ニューヨーク大学が最も多い学生数(50,550人)を、カリフォルニア工科大学最も少ない学生数(2,240)を持つと調査された。数学専攻上位大学の平均卒業率は93.33%であり、平均学生対教授の比率は8.58:1です。次の表は、数学専攻上位大学の合格率、卒業率などの重要な統計データを比較します。
| 順位 | 大学名 | 合格率 | 卒業率 | 学生数 | 学生対教授の比率 |
|---|---|---|---|---|---|
| 1 | マサチューセッツ工科大学 Cambridge, MA | 8% | 93% | 11,376名 | 3:1 (33.33 %) |
| 1 | プリンストン大学 Princeton, NJ | 7% | 97% | 8,181名 | 5:1 (20.00 %) |
| 3 | ハーバード大学 Cambridge, MA | 5% | 97% | 29,908名 | 7:1 (14.29 %) |
| 3 | カリフォルニア大学バークレー校 Berkeley, CA | 17% | 92% | 40,154名 | 18:1 (5.56 %) |
| 5 | スタンフォード大学 Stanford, CA | 5% | 94% | 17,184名 | 10:1 (10.00 %) |
| 5 | シカゴ大学 Chicago, IL | 8% | 94% | 15,775名 | 6:1 (16.67 %) |
| 7 | カリフォルニア工科大学 Pasadena, CA | 8% | 94% | 2,240名 | 3:1 (33.33 %) |
| 7 | カリフォルニア大学ロサンゼルス校 Los Angeles, CA | 18% | 91% | 43,548名 | 17:1 (5.88 %) |
| 9 | ニューヨーク市のコロンビア大学 New York, NY | 7% | 94% | 29,372名 | 6:1 (16.67 %) |
| 9 | ニューヨーク大学 New York, NY | 32% | 85% | 50,550名 | 10:1 (10.00 %) |
| 9 | のミシガン大学、アナーバー Ann Arbor, MI | 29% | 91% | 44,718名 | 12:1 (8.33 %) |
| 9 | エール大学 New Haven, CT | 6% | 98% | 12,458名 | 6:1 (16.67 %) |
| 平均 | 12.50% | 93.33% | 305,464名(総合) | 8.58:1 (11.65 %) |
数学 (Mathematics)専攻トップ10大学、2018年の授業料と2019年予想授業料を比較
次の表とグラフは、数学 (Mathematics)専攻トップ10大学の2017-2018年授業料と手数料を比較して、2018-2019年予測学費を示しています。2017-2018年金額は、米国教育省から正式に発表した資料に基づいており2018-2019年金額は、各大学の昨年の授業料引上げ率に基づいて計算された予測値です。
数学専攻上位大学の学部平均授業料と手数料は$49,296です。ニューヨーク市のコロンビア大学が$57,208で最も高い授業料、カリフォルニア大学ロサンゼルス校が$41,275で最も低い授業料を示しました。大学院の平均授業料は$44,765で調査され、シカゴ大学が$57,000の最も高い大学院授業料、カリフォルニア大学ロサンゼルス校が$28,105で最も低い大学院の学費が必要とされていることが分かっている。
| 順位 | 大学名 | 2018授業料と手数料 | 2019授業料と手数料 | ||
|---|---|---|---|---|---|
| In-State | Out-of-State | In-State | Out-of-State | ||
| 1 | マサチューセッツ工科大学 | $49,892 | $51,374 | ||
| 1 | プリンストン大学 | $47,140 | $49,054 | ||
| 3 | ハーバード大学 | $48,949 | $50,898 | ||
| 3 | カリフォルニア大学バークレー校 | $14,170 | $42,184 | $14,863 | $44,276 |
| 5 | スタンフォード大学 | $49,617 | $51,352 | ||
| 5 | シカゴ大学 | $56,034 | $59,816 | ||
| 7 | カリフォルニア工科大学 | $49,908 | $52,353 | ||
| 7 | カリフォルニア大学ロサンゼルス校 | $13,261 | $41,275 | $13,611 | $43,019 |
| 9 | ニューヨーク市のコロンビア大学 | $57,208 | $59,444 | ||
| 9 | ニューヨーク大学 | $50,464 | $51,906 | ||
| 9 | のミシガン大学、アナーバー | $14,826 | $47,476 | $14,357 | $47,953 |
| 9 | エール大学 | $51,400 | $53,394 | ||
| 平均 | $14,086 | $49,296 | $14,277 | $51,237 | |
| 順位 | 大学名 | 2018授業料と手数料 | 2019授業料と手数料 | ||
|---|---|---|---|---|---|
| In-State | Out-of-State | In-State | Out-of-State | ||
| 1 | マサチューセッツ工科大学 | $52,892 | $54,588 | ||
| 1 | プリンストン大学 | $48,940 | $50,722 | ||
| 3 | ハーバード大学 | $45,958 | $47,587 | ||
| 3 | カリフォルニア大学バークレー校 | $14,170 | $29,272 | $14,863 | $29,948 |
| 5 | スタンフォード大学 | $47,940 | $47,940 | ||
| 5 | シカゴ大学 | $57,000 | $59,245 | ||
| 7 | カリフォルニア工科大学 | $49,785 | $52,233 | ||
| 7 | カリフォルニア大学ロサンゼルス校 | $13,003 | $28,105 | $13,331 | $28,429 |
| 9 | ニューヨーク市のコロンビア大学 | $46,956 | $48,401 | ||
| 9 | ニューヨーク大学 | $43,848 | $45,379 | ||
| 9 | のミシガン大学、アナーバー | $22,696 | $45,484 | $23,635 | $47,369 |
| 9 | エール大学 | $41,000 | $42,236 | ||
| 平均 | $16,623 | $44,765 | $17,277 | $46,173 | |
Share this
Next
« Prev Post
« Prev Post
Previous
Next Post »
Next Post »
0 comments
Write comments